The Irrigate Project
Overview
I started thinking about how to monitor water usage after I had a high water bill. A sprinkler had been dislodged by the landscapers. The open sprinkler spewed water unhindered. Our water utility requires us to water after dark. The sprinkler went unseen, unheard and, consequently, unheeded from inside the house.
The resulting excessive flow caused my water bill to triple. We get water bills every month, delivered about a week after the measurement. By the time we notice the increased pattern in water usage, it could be more than a single billing cycle.
We have sixteen zones on our irrigation, and it takes about a half hour to test them and verify that they are all operating without a leak.
You can buy an irrigation controller that will monitor flow rates and shut off the water if the rate is above a preprogrammed limit. I think they are used mostly for golf courses or commercial parks. They start at about a thousand dollars. I hooked up a flow rate sensor to an Arduino, with a python program to sample the flows, for about three hundred dollars.
Use Case

Now I get an email every morning with a graph showing the minute by minute flow rate of our water usage, and also a table showing the number of gallons used hour by hour. The graph overlays flow rates for multiple days in varying colors, so I can easily compare one day's watering versus the same from a week ago. There is some variation due to source water pressure, but if a zone has a leak it will buck the trend and be pretty obvious.
The green line is the expected flow rate, as configured by the user. The red, purple, and blue lines are flow rates recorded. It looks like I need to adjust the clock on the irrigation controller, as it is starting about ten minutes late. The flow rates from the most recent day is red, and the least recent is blue. The days in between are of colors transitioning from red to blue. This specific graph illustrates a leak on the last node. The graph provides two clues that there is something wrong: some of the recorded flow rates diverge from others, and the high blue flow rates do not match the green expected line. I could tell which zone this was because it ran last of the five daily zones. I turned that zone on to try to locate the leak. Here is what I found:
Yard work had recently dislodged the spray head, and it had not been reinstalled properly. The head was leaking from around the base, but not enough that I would have ever noticed it unless I looked right at it when it was leaking. I screwed the spray head in more carefully and the flow came back in line with historical flow, as can be seen by the more recent (reddish) lines in the graph.

Parts List
| Name | Cost (as of Nov 2014) | Description |
|---|---|---|
| Hunter HFS | $149.50 | Hunter sprinkler flow sensor. Fits in many different sized pipes. A different fitting is purchased for each size. |
| Hunter FCT-100 | $35.50 | Sensor fitting for a one-inch pvc pipe. Different fittings are available for different sizes of pipes. The "100" means one inch PVC pipe. 150 is for 1.5 inch, &c. |
| 4x ~290 Ohm resistors | $1.44 for ten | 290 Ohm is Red-White-Brown. |
| 1x ~1k Ohm resistor | $0.78 | 1k Ohm is Brown-Black-Red. This is for limiting the current to the LED. |
| Arduino | ~$30 | These can be found a bit cheaper |
| Arduino Ethernet shield | ~$40 | These can be found a lot cheaper |
Flow Sensor
The Hunter flow sensor was cheaper than the next best alternative, the Toro TFS-100, which sells for around $250 but does not seem to require a special fitting. There is also a $400 Rainbird sensor.

Hunter |

Toro |

Rainbird |
The Hunter is the cheapest but it comes as two separate parts. One part is the sensor, and the other is a PVC fitting that it goes into. The fitting is installed in the line. It comes with a dummy insert that lets the owner remove the sensor and still operate the pipe. However, this configuration is inherently more prone to leaking than the one-unit solution that Toro offers. If the sensor is under constant water pressure, then the Toro might be a better option.
All three of these are similar in that they have two leads going to them and seem to be interchangeable from the perspective of the electronics. A current flowing through the two leads will exhibit different electrical properties depending upon the orientation of a paddle wheel which sits in the flow of the pipe. The amount of water that has flowed past the sensor can be determined by counting the number of times that the properties have changed.
Electrical Properties of the Hunter HFS
I've only ever had the Hunter flow sensor, but I suspect the others work in a similar manner, since I saw a reference to one being interchangeable with other brands. I wrote an Arduino sketch to work like a triggered oscilloscope. After the trigger voltage was breached it would sample the analog pin voltage as fast as it could. When memory was filled up it would dump a text line bar graph of the voltage to the serial port. The result was that when the paddle was in one orientation it had a constant voltage, but when it was rotated 1.57 radians it oscillated between two different voltages. In the past I've done some work with infrared remote controls. That experience leads me to believe that the commercial controllers are probably sensing flow by looking for the oscillating voltages, but I'm just guessing.
(By the way, I would love to get some additional information on this. Please tell me if you know how the sensor works to create an oscillating resistance. The paddle wheel seems to be rotating free... i.e., not driving a gear, shaft, or anything of the like. The paddle wheel probably has a magnet or magnetic sensitive material at the ends of the wheel, or perhaps one cross paddle has an iron or magnetic core that itself spins.)
The Circuit
Attach the ethernet shield onto the Arduino.
Optionally, a brighter LED can be added to pin 9. Connect a 1k ohm resistor in series with an LED connecting Arduino pin 9 and ground. (The flat edge of the LED should connect to ground, and the resistor connects the lead near the round edge to pin 9.) This provides a brighter LED light that can be more easily seen. The light is a toggled by a downsampling of the ticks. When there is no flow it remains on or off, whatever its state was when the flow stopped.
The anole is also optional.
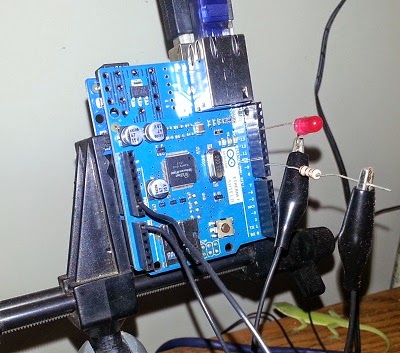
Connect four 290 Ohm resistors in series.
Connect one end of the chain of resistors to the negative end of a 15 Volt power supply. Also connect it to the Ground pin on the Arduino.
Connect the other end of the resistors to the black wire on the flow sensor.
Connect pin A0 of the Arduino to the middle point of the four resistors.
Connect the red wire of the flow sensor to the positive end of the 15 volt power supply.

Sensor Readings
Below is a graphing of the voltages, as seen by a tight Arduino loop.
Each sample is probably about 0.1 milliseconds (the analog read speed
of the Arduino). This was generated from the oscilloscope
sketch in the sketches directory.
===Capture:
----------------------------------------------------------------------------....................  814
-----------------------------------------------------------------...............................  697
--------------------------------------------------------------------------......................  793
-------------------------------------------------------------------------.......................  779
----------------------------------------------------------------................................  690
----------------------------------------------------------------------------....................  812
-----------------------------------------------------------------...............................  698
----------------------------------------------------------......................................  625
--------------------------------------------------..............................................  535
---------------------------------------------...................................................  485
-------------------------------------------.....................................................  459
-----------------------------------------.......................................................  446
-----------------------------------------.......................................................  439
----------------------------------------........................................................  435
----------------------------------------........................................................  434
----------------------------------------........................................................  433
----------------------------------------........................................................  432
----------------------------------------........................................................  432
----------------------------------------........................................................  432
----------------------------------------........................................................  432
----------------------------------------........................................................  432


===Capture:
----------------------------------------........................................................  433
----------------------------------------........................................................  434
----------------------------------------........................................................  433
----------------------------------------........................................................  433
----------------------------------------........................................................  433
----------------------------------------........................................................  433
----------------------------------------------------------------------..........................  750
---------------------------------------------------------------------------.....................  803
------------------------------------------------------------------..............................  714
----------------------------------------------------------------................................  688
----------------------------------------------------------------------------....................  814
----------------------------------------------------------------................................  691
Note that the switch from low to high is instantaneous, but from high to low it takes about a milliseconds to complete. Also note how the high voltage state oscillates at a frequency on the order of 5 KHz.
The Effect of Using Different Resistances

This graph shows the high and low current and voltage for various resistances. The supply voltage was 15 volts. The voltage was measured across the resistor, not across the flow sensor. Note that the high voltage and current fluctuate, as indicated above. This data was recorded on a multimeter. The ideal resistance is one that sufficiently differentiates the high and low voltages as well as has a sufficiently low flow current that energy is not needlessly wasted.
Setting Up the Software
Current distribution is via a zip file. Unzipping it should install all the necessary files in the current directory. This includes several python files, an irrigate.csh launching script, a doc directory (where this file lives), and a sketches directory, where the code ("sketch") to run on the Arduino can be found. The project is licensed under Apache License 2.0.
Runnable scripts
The executable scripts are:- irrigate.py: Main executable. This is the proper way to run the unit tests. It can also send the daily email.
- irdb.py: Long running process to sample the sensor and put results in an sqlite database. It also can be run to manipulate the database (clean in up, export/import data, &c.).
- iremailer.py: The emailer script. Running this will send the daily email.
- iroverflow.py: Tests for a long duration flow indicating a water leak. A command line parameter tells it how long it should wait before reporting the leak. If flow does not cease for at least a minute during that time then emails will start being send out with graphs indicating the flow that has been detected.
The rest of the scripts help to implement the system and should not be run by themselves.
To get the system running I recommend using "crontab -e" on a linux box to set up the cron files. Run the irdb.py on reboot. Run it with the "--verify" parameter every fifteen minutes or so. Run iremailer.py in the morning, and iroverflow every fifteen minutes or so.
  # m  h dom mon dow   command

  @reboot              ( cd /home/usrname/Code/irrigate && irrigate.csh & )
  */10 * *   *   *     ( cd /home/usrname/Code/irrigate && ( python irdb.py --verify >>& logdb ) ) &
  0    6 *   *   *     ( cd /home/usrname/Code/irrigate && ( python iremailer.py >& logemail ) ) &
  */15 * *   *   *     ( cd /home/usrname/Code/irrigate && ( python iroverflow.py --minutes=180 >>& logover ) ) &
If you have any difficulty when setting this up please contact me so that I can improve the documentation.
You will need to configure some things in the irconfig.py file, such as the IP address of the Arduino (which is assumed to have an ethernet shield), as well as the irrigation schedule that you have running, including the expected flow rates. Also, the IRWEB_URL parameter indicates what email address should be included in the emails to get live readings. (This provides a veneer of security while simplifying setup.) You'll also want to configure your irrigation's schedule. Most everything in all caps will need to be looked at.
irrigate.py
Usage: irrigate.py [options]

Some useful invocations:
  irrigate.py -l -w   Start in production mode with web service support.
  irrigate.py -u ALL  Run all the unit tests. This uses a pretender.
  irrigate.py -e      Start up, send an email now, and exit.


Options:
  -h, --help            show this help message and exit
  -u UNITTEST, --u=UNITTEST
                        Run unit tests. Specify a comma separated list of all,
                        db, dbff, dbperf, email, flowrates, outtage, outtage2,
                        overflow, realtime, reload, sensor, statics, web.
  -r, --r               Realtime sampler.
  -w, --web             Enabled web server.
  -p, --pretender       Use a pretender instead of actually connecting to
                        Arduino.
  -e, --emailnow        Send an email.
  --loglevel=LOGLEVEL   One of CRITICAL,ERROR,WARNING,INFO,DEBUG.
irdb.py
Usage: irdb.py [options]

Some useful invocations:
    irdb.py              Connect to default address and record data.
    irdb.py -u ALL       Run all the unit tests. This uses a pretender.
    irdb.py --verify     Check if there is already a version running, exit if so
                       but otherwise send an email and keep running.


Options:
  -h, --help            show this help message and exit
  -v, --verify          Verify that the process is running. If it detects a
                        recent db update then it quickly exits. If there is no
                        recent activity then it emails  the recent log to the
                        configured email address and it starts up as usual.
                        This should probably be the default. May I suggest a
                        cron job: Run crontab -e as the user to run irdb and
                        edit the crontab to add an entry "*/10 * * * * python
                        irdb.py --verify"
  -u UNITTEST, --u=UNITTEST
                        Run unit tests. Specify a comma separated list of all,
                        db, dbff, dbperf, outtage, outtage2.
  --interval=INTERVAL   Sample interval in seconds. Default is 10.
  --loglevel=LOGLEVEL   One of CRITICAL,ERROR,WARNING,INFO,DEBUG.
  --consolidate         Consolidate the readings in the db and rewrite it.
                        This mostly just removes zero readings, but it
                        drastically reduces the size of the db and allows
                        quicker operations such as sending emails. Don't
                        consolidate if there might be multiples.
  --demultiple          Remove readings when it looks like there are multiple
                        processing getting readings and adding them to the db.
                        If you also want to consolidate then be sure to run
                        this first.
  --fromflat=FROMFLAT   Import from the given flat file and exit.
  --export=EXPORT       Export to the given flat file and exit.
  --sqlname=SQLNAME     Name of the sql file to use.
  -p, --pretender       Use a pretender instead of actually connecting to
                        Arduino.
iremailer.py
Usage: iremailer.py [options]

Some useful invocations:
  iremailer.py            Start up, send an email now, and exit.
  iremailer.py -l DEBUG   Send email with log level at DEBUG.


Options:
  -h, --help           show this help message and exit
  --loglevel=LOGLEVEL  One of CRITICAL,ERROR,WARNING,INFO,DEBUG.
iroverflow.py
Usage: iroverflow.py [options]

This program will check the recently polled data and send an email if
appropriate.

Normal use is to install with crontab -e:
    */15 * * * * python iroverflow.py -m 360

Remember that there is no state to this. Once an overflow occurs it will
continue to email everhy 15 minutes until the overflow condition stops.


Options:
  -h, --help           show this help message and exit
  --loglevel=LOGLEVEL  One of CRITICAL,ERROR,WARNING,INFO,DEBUG.
  --minutes=MINUTES    Email if flow has not stopped for MINUTES minutes.
  --gallons=GALLONS    Not yet implemented. Flowing GALLONS in MINUTES.
  --sqlname=SQLNAME    Name of the sql file to use.
Future work
The project is complete and usable, but there are many improvements that can be applied:
- Better web server: I want to make the irweb module produce a better looking web page. I'd like it to have high resolution graphs of recent flow, and to update in real time. I'll have to learn jQuery for that.
- Non-Arduino support: I would like to see the code ported to non-Arduino hardware. In particular, both the Arduino and Python code could be ported to a Beaglebone black device. Also, there is a kickstarted for a wipy device which is a small board that runs Python and has a wifi built in. It has an 8 Mhz processor and quite enough ports to do the sampling, but perhaps not enough for controlling a bank of valves.
- Replace the irrigation controller: The Arduino code and Python protocol supports controlling the zones via the Arduino. I would need to write a scheduling script and assemble the hardware. The main reason I haven't done this is lack of time at home. (Most of this has been done on the bus.)
- Production polish: It could use some polishing. Log files don't ever rotate. The web server takes an obfuscated path instead of using a password, cookie, or security token. The certificate has expired and is invalid. I should make irconfig into a key-value file for all the common stuff, and put the code in another file.
- Fix monsoon readings: Sometimes the sensor registers flow when there is none. This usually happens after heavy rains. I think it might be drawing the voltage down. It so happens that if geniune flow happens, sometimes the false flow disappears. This appears to be due to the non-alternating mode not crossing the threshhold. Perhaps I should look for alternating/vibrating voltages or the absence of alternation, instead of looking for voltage to be over/under a threshhold. I should look into it.
Links
I haven't seen anybody do the exact same thing online, but there are a few similar projects.
- Measuring home water consumption with Raspberry Pi. Cuddleburrito wanted to monitoring water usage in the house. Rather than fit each sink, shower, and toilet with a flow sensor he realized that most of the time the taps are open full throttle. Having measured the max flow rate once, he just needs real time monitoring of when water is flowing.
- Monitoring residential water usage by putting a magnet next to the meter.
- Driblet A flow sensor which powers from the water flow and uploads water usage data to the cloud. As of June 2015 this does not seem to exist yet. First seen in 2013.
- Detecting water flow with microphones You can tell which tap in a house is being used by putting a microphone on the pipe. You can even get a sense of flow rate. That would be useful to differentiate household usage.
No comments:
Post a Comment